Manage Clients > Reports > Performance Details
The Performance Details section of the Investments Menu gives you several paths to drill down into performance data and includes additional options and controls.
View Controls
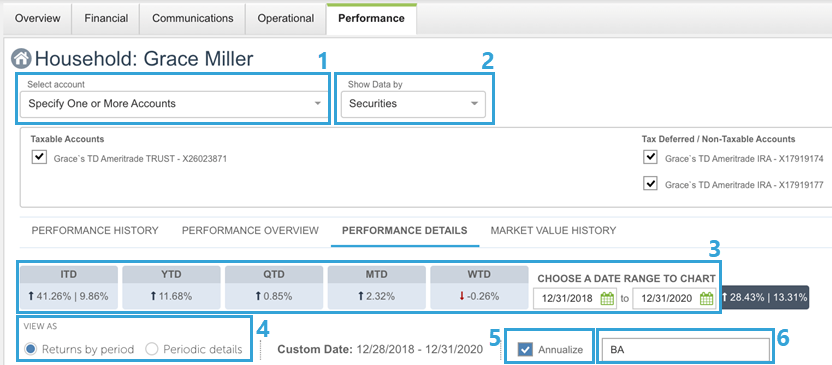
The following view controls are available in Performance Details:
- Select account: By default this is set to All Account(s). Changing this drop-down to Specify One or More Accounts causes a new box to appear where you may remove or mark which accounts you want included in the reporting.
- Note that single accounts will display based on their individual Net/Gross Fees setting. If you select all accounts or a combination of accounts with different Net/Gross settings, the setting for the Household will be applied.
- Show Data by: At the top, in addition to specifying accounts, you can choose whether to display the performance details by the following selections. Further details on these selections can be found below.
- Account Name
- Asset Class
- Client Name
- Securities
- Reporting Performance Period controls: Located just below the sub-tabs, you can choose to view reporting based on Inception to Date (ITD), Year to Date (YTD), Quarter to Date (QTD), Month to Date (MTD), Week to Date (WTD), or specify your own date range. The ending date for the selected period is typically the prior business day. The ITD selection displays as “Total% | Annualized%” if the period is longer than one year.
- View As: Just below the Performance Period Selector, choose whether to view details by the following selections. Further details on these selections can be found below.
- Returns by period
- Periodic details
- Annualize: If a period greater than a year is specified, check this box to display both the total performance and the annualized performance as “Total% | Annualized%”.
- Search by symbol or name: Use this search to show only securities that match the search criteria entered.
Options for “Show Data By”
In addition to specifying accounts, you can choose whether to drill into the performance details from the top down as follows:
Note that since fees are not assessed at the asset class or security level, performance in these categories is always net-of-fees regardless of other settings for the account, client, or household.
- Account Name: Data is shown from the top down at the following three levels:
- Account Name
- Asset-classes with each Account
- Securities within each Asset-class
- Asset Class: Data is shown from the top down at the following three levels:
- Asset Category: Stocks, Bonds, Cash, Other
- Asset Class (investment style): Asset Classes defined by the advisor take precedence. For securities not assigned to an Asset Class by an advisor, the AdvisorEngine default asset class is used.
- Securities
- Client Name: Data is shown from the top down at the following three levels:
- Client: Accounts belonging to the same tax ID / SSN are considered a single Client.
- Asset Class (investment style): Asset Classes defined by the advisor take precedence. For securities not assigned to an Asset Class by an advisor, the AdvisorEngine default asset class is used.
- Securities
- Securities: This view combines all holdings at the security level for the selected accounts and time period, regardless of client, account, or asset-class.
Options for “View As”
Returns by Period
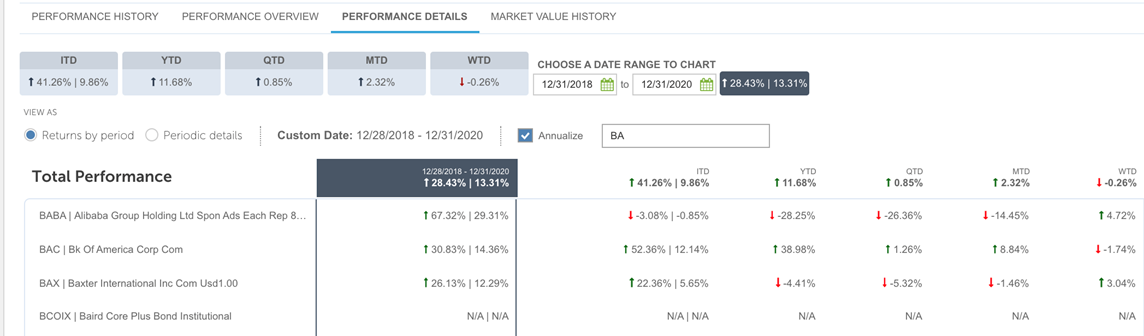
Returns by Period displays a table of the performance of securities held on the last day of the selected period. This view always includes the most widely used industry-standard periods (ITD, YTD, QTD, MTD, WTD). Further details:
- Specifying a custom date range will add another column to the table for the chosen range.
- Selecting a performance period will highlight the relevant column for easy viewing.
- Total Performance across the top of the chart shows the combined and weighted performance for the selected accounts. It includes the effects of all securities held during the period displayed, even if they are no longer present in the account(s).
- If a security’s performance cannot be calculated (typically due to a lack of continuous history), N/A is displayed.
- For non-cash securities, performance is calculated based on market value history, adjusted for contributions (purchases) and withdrawals (sales) as well as income.
- Due to complexities created by fluctuating cash balances and the difficulty accruing money market dividends, performance for Cash is globally displayed as flat (0%) for all periods.
Periodic Details
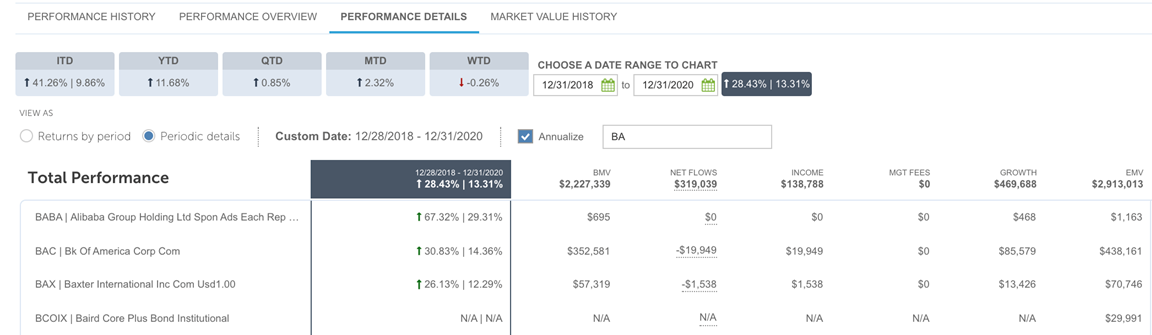
Periodic Details zooms in for a closer look at the drivers of change for a single specified period. Each row displays a summary of changes in various categories across the selected period for securities in the selected accounts on the last day of the selected period. Columns include:
- Performance: Performance across the selected performance period. If the security was not present for the entire period or if there was a break in the history of the security, this displays N/A.
- Beginning Market Value (BMV): Market Value at midnight of the day before/first day of the performance period.
- Net Flows: The sum of all contributions (purchases) and withdrawals (sales) for the performance period. Hovering over an entry in this column shows more details about contributions and withdrawals.
- Income: The sum of all income for the performance period, including ordinary dividends and capital gain distributions.
- MGT Fees: Performance at the security level is gross of advisory management fees and always defaults to $0 for at the security level. Any advisor fees that were deducted during the selected period are factored in at the Total Performance level.
- Growth: Market variation in the value of the security.
- Ending Market Value (EMV): Market value as of close of business on the last day of the performance period.
Important reporting notes:
- When selecting a performance period, only securities that were held continuously through the selected period will be displayed in the results. Any securities terminated on or before the final day of the period will not be included. Note that as time passes, fewer securities are continuously held in an account from the inception date up to the present day. More of the currently-held securities will appear as shorter periods are selected.
- In order to comply with industry standard practice for calculating the most accurate performance, BMV and EMV include accrued income where available. As a result, the EMV of individual securities as of the last day of the performance period may not equal the EMV of the account(s), which omit accruals at the aggregate level when displayed so that it can more readily tie back to custodial market values (such as on statements).
- Income paid by a security, once it is received as cash, is no longer reflected in the value of the position and is considered a “withdrawal” from that security. As a result, amounts that show up as positive in the Income column also show up as a negative in the Net Flows column (under the Withdrawals sub-component).
- Income that is reinvested into new shares is considered a new purchase, which shows up as a positive in the Net Flows column under the Contributions sub-component. For example, a $10 payment that is not reinvested will show up as a positive under Income and a $-10 withdrawal under Net Flows. If reinvested, the $10 will show up as a positive under Income and $0 under Net Flows because the outflow and inflow offset each other. Hovering over Net Flows will display a $-10 withdrawal and a $10 contribution.
Related Articles
Manage Clients > Reports Menu
The Reports menu of the Profile navigation menu gives quick access to financial and performance data for the profile selected. Many of the sections have controls to allow you to manipulate the data such as a column chooser, sorting, and grouping. The ...Manage Clients Dashboard Overview
The Manage Clients Dashboard is your home to create and view dynamic reports of data across your client base, from lists of clients, accounts, households, holdings, performance, and more. Each report can be completely customized to quickly and ...Manage Clients Dashboard Report Templates
AdvisorEngine provides a number of templates you can start from when Creating a New Report. These templates can be loaded and further adjusted to suit your needs as a saved report. To access the list of templates available, navigate to Manage Clients ...Performance Benchmarks: Assigning Benchmarks to Households
In addition to the three default Total Performance benchmarks that can appear globally in Performance reports, an advisor can designate an additional benchmark at the Household level for any individual Household. Before begining, ensure that ...Adding Dashboard Reports to the Client Profile
Custom Reports created through the Manage Clients Dashboard can be added to the Reports menu on the Client Profile for quick access to a firm-customized view for a specific household, client, or account. Reports added to the client profile are ...