Revenue Dashboard and Reports
The Revenue Dashboard, available from Run Business > Revenue shows all billing activity for a selected billing group and billing period, giving full visibility into various revenue reports. Admins and Advisors can use the dashboard to find cash shortages and missing fee schedules, as well as develop a deeper understanding of how a client’s fees are collected.
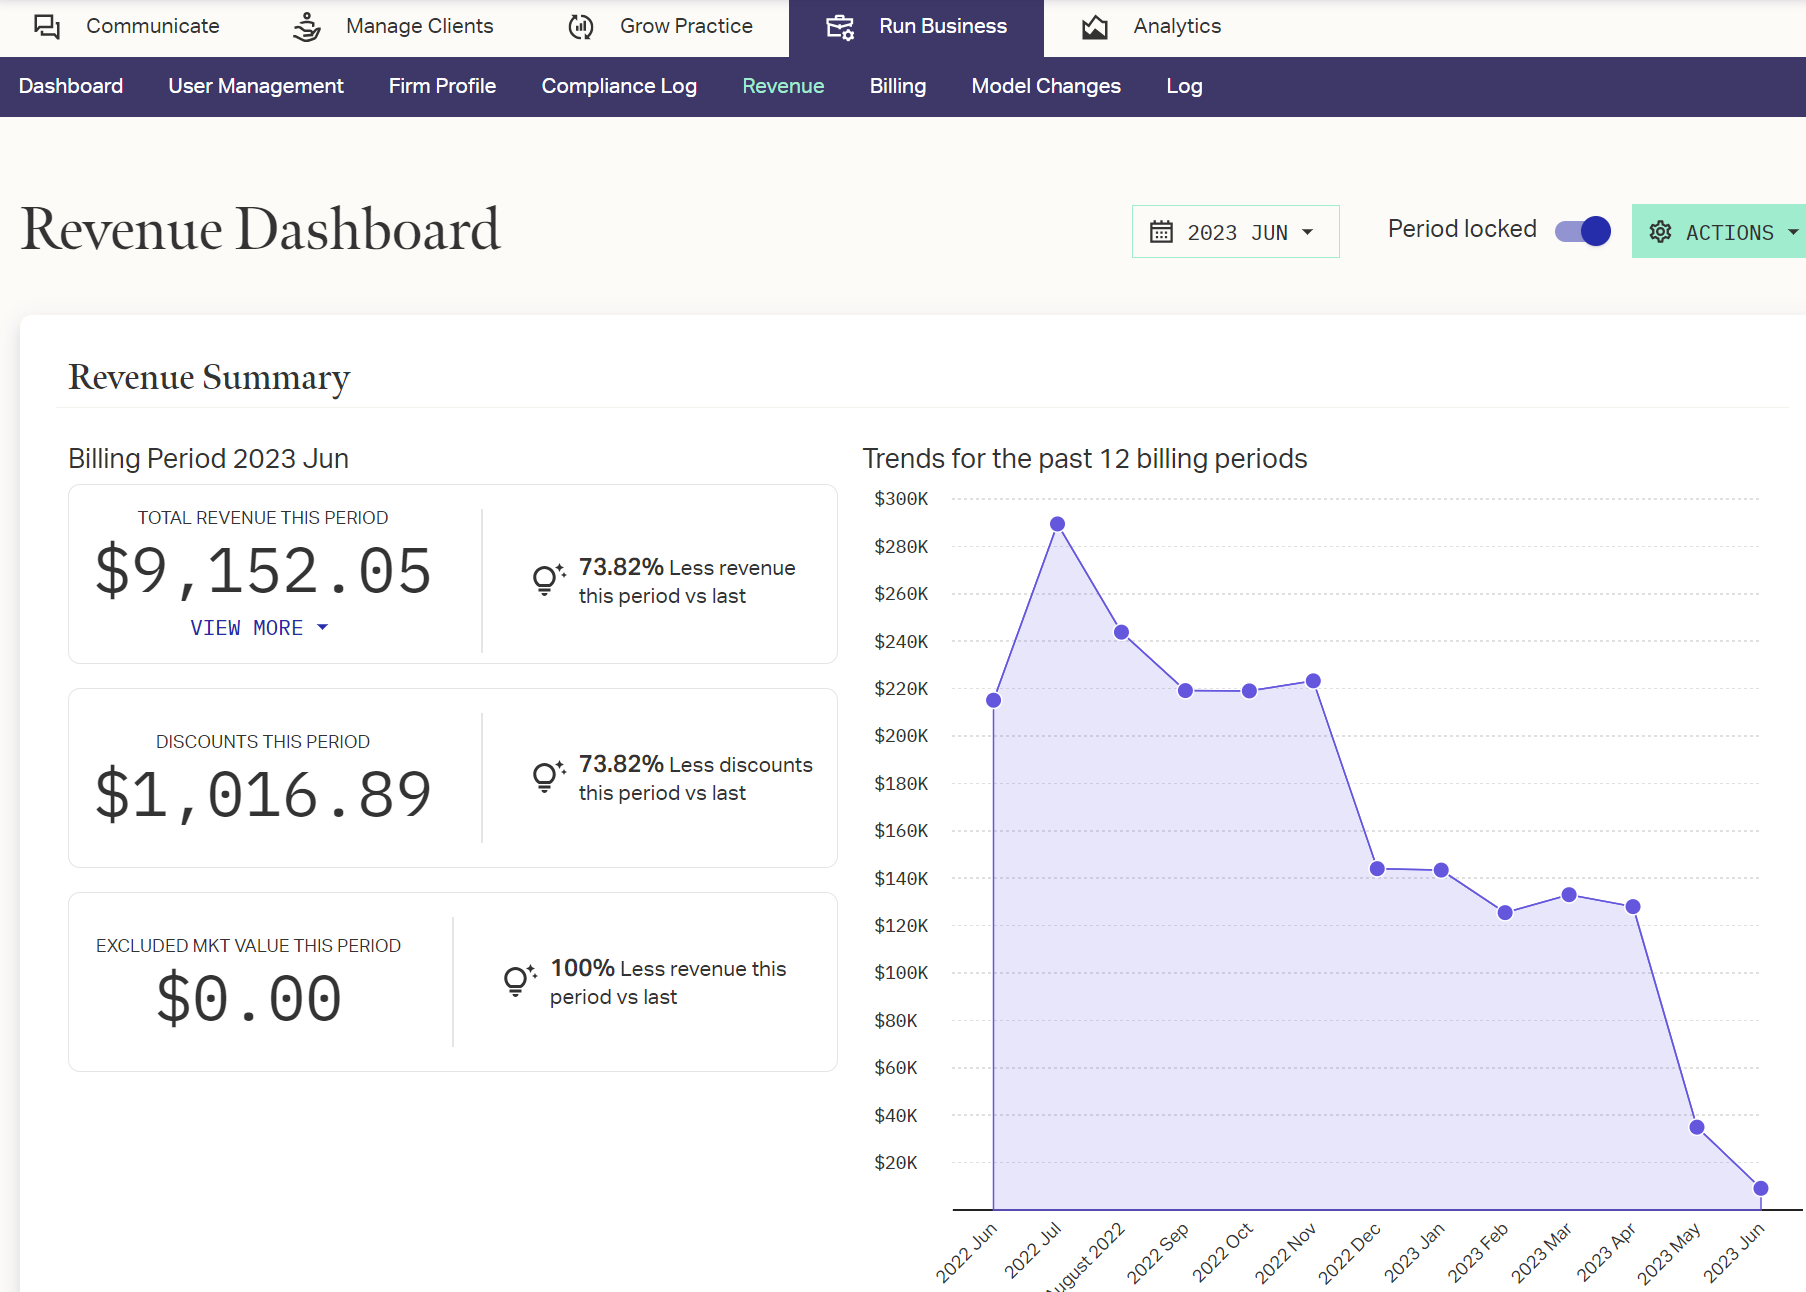
The data shown on the Revenue Dashboard reflects the billing group and period set across the top. By default, it will display the current billing period. Use the drop downs in the upper right to show a different group or period if desired.
If your firm only has one billing group, the Billing Group drop-down does not display.
To the right of the Billing Period selection, the following controls are available:
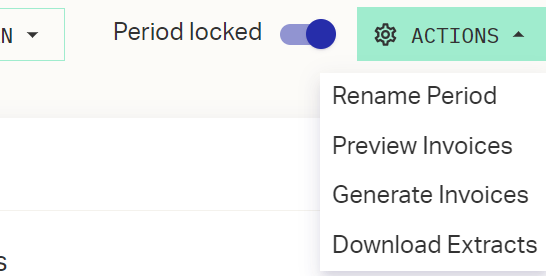
- Lock/Unlock Period: Mark the billing period complete and set the data to read-only or vice versa (See Locking the Billing Period).
- Actions > Rename Period: Change the name of the currently selected billing period.
- Actions > Preview Invoices 1: Generate a sample invoice of a particular account.
- Actions > Generate Invoices 1: Generate invoices for all clients for the billing period (See Generating Fee-Billing Invoices).
- Actions > Download Extracts: Download a zipped file of the extracts that can be sent to the custodian (The text files will need to have the extension changed to from .txt to .csv).
1 These options are only available once the billing period is locked.
The Revenue Dashboard is divided into three sections: Revenue Summary, Account Details, and Percentage of Revenue by Type, detailed below.
Revenue Summary
The Revenue Summary Trends chart shows period over period comparisons of total revenue. Hover over any point on the chart for a breakdown showing Total, Discounts, and Exclusions for that billing period.
The breakout sections on the left provide the following details:
- Total Revenue: Shows the revenue generated for the selected period.
- Total Adjustments: Only shows for firms using Advance billing. Shows the total adjustments made over the period, along with a breakout view showing flows, account closings and account openings.
- Total Discounts: The total dollar amount of discounts given for the selected period.
- Total Exclusions: The total dollar amount of exclusions for the selected period.
Available Reports
By clicking under the Total Revenue This Period amount, the following reports can be accessed and exported:
- Account Fee Collections: Full detail report on the fee billing for each account in the period.
- Advisor Payee Report: Full report on fees paid to advisors for the period. Does not display if your firm does not use advisor fees.
- Firm Payee Report: Full report on fees paid to the firm for the period. Does not display if your firm does not use firm fees.
Use the button in any of these reports to create a downloadable PDF or XLS (excel file) of the report table.
Account Details
The Account Details Trends chart shows period over period comparisons of accounts billed, cash shortages, and accounts in error. Hover over any point on the chart for a breakdown showing the totals of each of these three values for that billing period.
The breakout sections on the left provide the following details:
- Total Accounts Billed: The total number of accounts that are being billed for the selected period.
- Cash Shortages: View accounts with less cash than the total fee amount for the period.
- Accounts in Error: Lists accounts that have failed at any fee generation. Possible error conditions include:
- No holdings open during period.
- No applicable fee schedule.
- Account belongs to more than one billing household.
- Total Advisors Billing: Number of advisors receiving advisor fees during the selected period.
Available Reports
By clicking under appropriate section, the following reports can be accessed and exported. Note that some of these reports are available in the previous section as well:
- Total Accounts > Account Fee Collections: Full detail report on the fee billing for each account in the period. Same as Account Fee Collections above.
- Total Accounts > Billing Reconciliation: Compare the calculated fees from the Billing Engine with the actual fees that were deducted from the account. Available only after the period has been billed.
- Cash Shortages: View accounts with less cash than the total fee amount for the period.
- Accounts in Error: Lists accounts that have failed at any fee generation. See Accounts in Error report above for possible error conditions.
- Total Advisors Billing > Advisor Payee Report: Full report on fees paid to advisors for the period. Does not display if your firm does not use advisor fees.
- Total Advisors Billing > Firm Payee Report: Full report on fees paid to the firm for the period. Does not display if your firm does not use firm fees.
Use the button in any of these reports to create a downloadable PDF or XLS (excel file) of the report table.
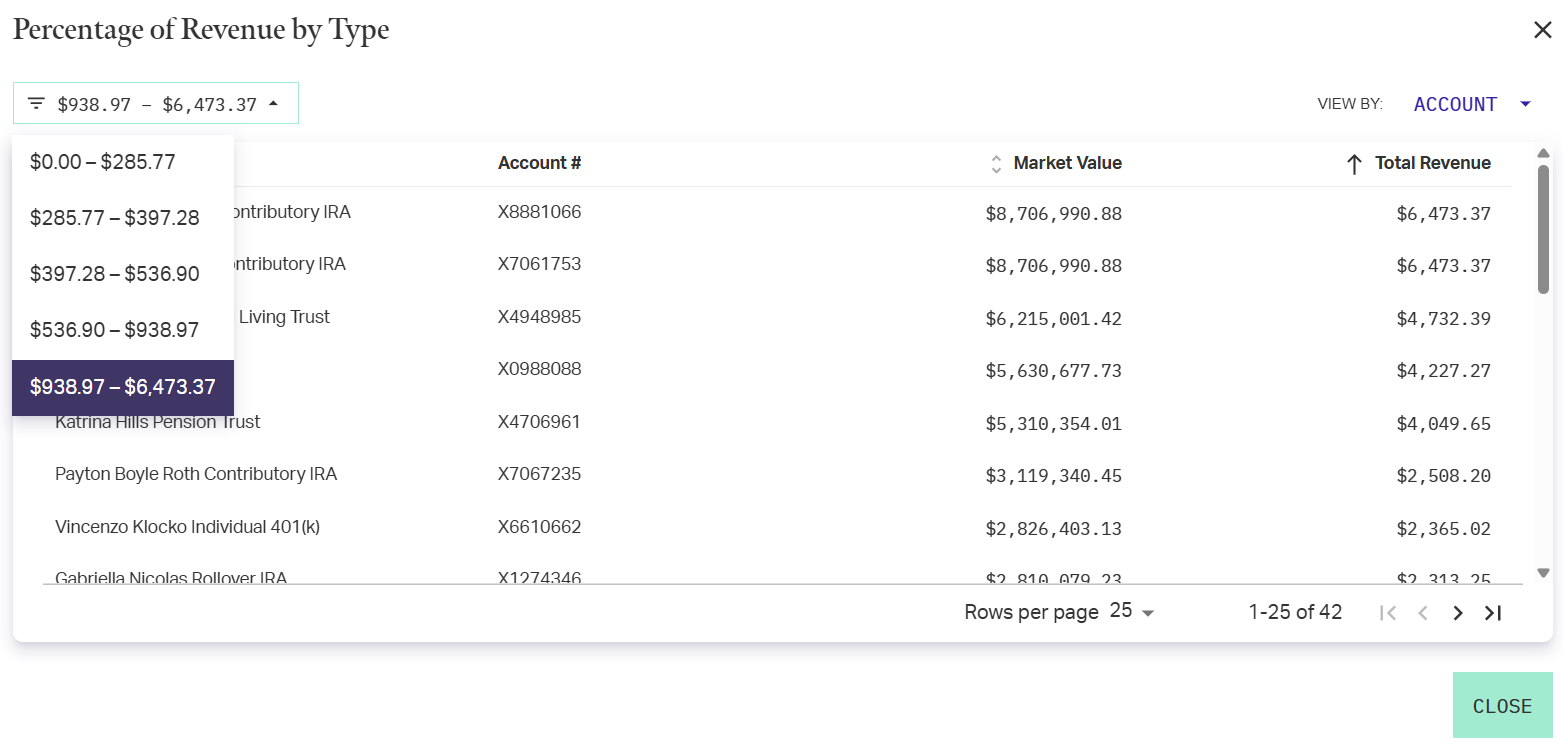
Percentage of Revenue by Type
The Percentage of Revenue by Type chart shows period over period comparisons of revenue broken down by quintiles. The chart can show fees by Account, Household, or Advisor using the drop-down in the upper right. Hover over any bar on the chart for a breakdown showing the revenue ranges and exact numbers of accounts, households, or advisors in each quintile.
The breakout sections on the left provide the following details:
- Median fee per account/household/advisor.
- Fee range and total for the largest account section.
- Fee range and total for the highest total revenue section.
Click on either of the bottom two tiles to see a breakdown of the accounts/households/advisors in that range. When looking at the detail grid, you can change which quintile range you are viewing with the drop-down in the upper left.
Related Articles
Dashboard Card: Year-to-Date (YTD) Revenue
Year-to-Date (YTD) Revenue is a visualization card available for AdvisorEngine CRM Dashboards. For a full list of available cards, see Dashboards Card Library. Year-to-Date (YTD) Revenue The Year-to-Date Revenue reports the total Client Revenue this ...Billing and Revenue Overview
The AdvisorEngine Portfolio Management Suite contains a robust billing engine that allows you to set broad billing settings to your firm’s preferences while fine tuning the billing settings for any client or account as needed. Calculations are made ...Dashboard Card: Revenue by Advisor
Revenue by Advisor is a visualization card available for AdvisorEngine CRM Dashboards. For a full list of available cards, see Dashboards Card Library. Revenue by Advisor Revenue by Advisor displays how much Revenue up to 10 Advisors have brought in ...Dashboard Card: Revenue by Type
Revenue by Type is a visualization card available for AdvisorEngine CRM Dashboards. For a full list of available cards, see Dashboards Card Library. Revenue by Type The Revenue by Type card shows a pie chart of revenue types for selected Advisors ...Adding Dashboard Reports to the Client Profile
Custom Reports created through the Manage Clients Dashboard can be added to the Reports menu on the Client Profile for quick access to a firm-customized view for a specific household, client, or account. Reports added to the client profile are ...